Annual Report 2021 Appendix
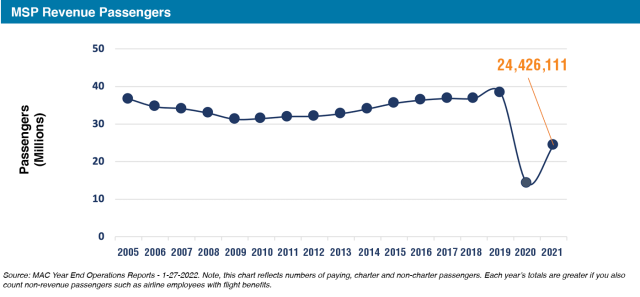
This appendix is prepared in accordance with the requirements of Minnesota Statutes Section 473.621. It presents MSP passenger and aircraft operations activity, current airport capacity in terms of operations and passenger enplanements, average length of delay statistics, and technological developments affecting aviation and their effect on operations and capacity at the airport. This appendix also includes the number of operations and based aircraft at each of the MAC’s Reliever Airports in 2021 compared with 2020.

Airfield Capacity
Airfield capacity is typically described in terms of hourly capacity and annual capacity under various weather conditions. The table below reflects the hourly capacity for MSP in optimum, marginal and poor weather conditions.
MSP’s current airfield capacity is 158 aircraft operations in optimum conditions. When instrument flight rules are being used due to low-level, heavy cloud cover and/or low visibility capacity drops to 114 operations.

Airfield Delay
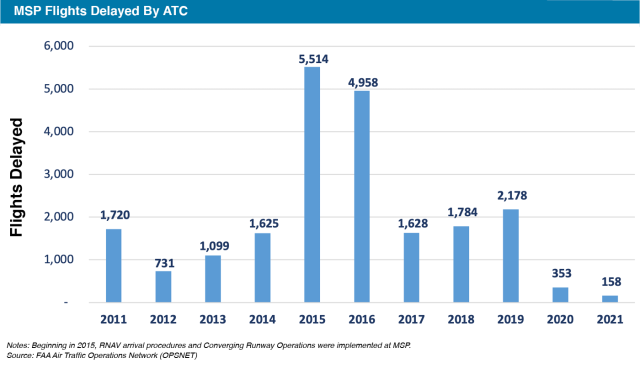
The FAA Air Traffic Operations Network (OPSNET) database counts flights that were reported by Air Traffic Control (ATC) to be delayed for more than 15 minutes. The chart above depicts the annual number of MSP flights delayed by ATC in 2011 through 2021.
The FAA combines arrival and enroute delays into one category, and reports delays for aircraft that accumulate 15 minutes or more holding delay at each facility throughout the entire route of flight. Delays of fewer than 15 minutes are not counted, nor are delays not initiated by ATC.
In 2021, there were 158 delayed flights at MSP, which is a decrease of 195 flights when compared to 2020.
The MAC has initiated a Long-Term Plan update for MSP that will assess future facility requirements necessary to meet projected passenger and aircraft operation demand. A component of the Plan will quantify current and future airfield delay statistics to determine the capacity of the current MSP airfield. The Plan will also consider potential airfield alternatives designed to efficiently accommodate future demand. The Plan is expected to be completed in 2022.
Airfield Delay per Aircraft Operation
When calculating the average delay per flight operation, delay is averaged by each flight’s taxi time and airborne time. The total averaged delay is expressed in minutes of delay per operation. The current industry standard for estimating delay is established by the FAA Aviation System Performance Metrics (ASPM). The FAA uses ASPM results to create performance benchmarks for airports each year. Since 2005, use of ASPM data has been a well-supported methodology to calculate aircraft delays, accepted by both government and industry, as the most valid, accurate and reliable metric.[1]
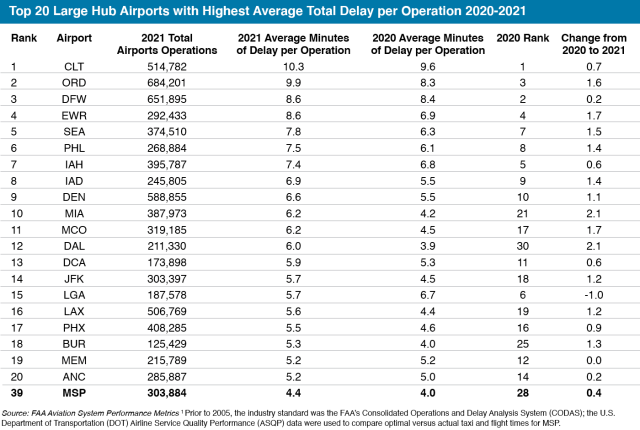
When compared to other large hub U.S. airports as shown in the table below, MSP ranked 39th with an overall average delay of 4.4 minutes in 2021; in 2020 MSP ranked 28th with an overall average delay of 4 minutes.
Technological Developments and Capacity Enhancements at MSP
The FAA continuously explores potential capacity-enhancing development/technology to increase airport efficiency and reduce delay. When advances are identified, efforts are made to implement the technology at the busiest airports. This section describes these efforts as they apply to MSP.
Installation of ASDE-X at MSP was completed in 2009 and provides seamless coverage for complete aircraft identification information. This equipment also allows for future implementation and upgrade to Next Generation (NextGen) navigation technology (Automatic Dependence Surveillance – Broadcast, "ADS-B"); ADS-B uses a Global Navigation Satellite System to broadcast critical information.
In 2021, aircraft operating at MSP were equipped with ADS-B/Cockpit Display of Traffic Information (ADS-B/CDTI) technology per federal policy for aircraft operating in capacity-constrained airspace, at capacity-constrained airports (including MSP) or in any other airspace deemed appropriate by the FAA.
Ongoing Precision Instrument Approach Capabilities
In addition to runway separation and configuration, airfield capacity can be affected greatly by how the runways are equipped for inclement weather. A number of precision instrument approaches continue to be available at MSP as summarized in the table below.

Notes: The term decision height is defined as the height at which a decision must be made during a precision approach to either continue the landing maneuver or execute a missed approach.
Precision approaches are categorized based on decision height and the horizontal visibility that a pilot has along the runway. Visibility values are expressed in statute miles or in terms of runway visual range (RVR) if RVR measuring equipment is installed at an airport. The different classes of precision instrument approaches are:
i. Category I (CAT I) – provides approaches to a decision height down to 200 feet and a basic visibility of ¾ statute miles or as low as 1,800 feet runway visual range (RVR).
ii. Category II (CAT II) – provides approaches to a decision height down to 100 feet and an RVR down to 1,200 feet.
iii. Category IIIa (CAT IIIa) – provides approaches without a decision height (down to the ground) or a decision height below 100 feet and an RVR down to 700 feet.
iv. Category IIIb (CAT IIIb) – provides approaches without a decision height or a decision height below 50 feet and an RVR down to 150 feet.
v. Category IIIc (CAT IIIc) – provides approaches without a decision height and RVR. This will permit landings in "0/0 conditions," that is, weather conditions with no ceiling and visibility as during periods of heavy fog.
The MAC's Reliever Airports
The MAC’s six general aviation reliever airports are open for public use 24 hours per day. Aircraft operators must choose an airport at which to base their aircraft. Airports in Minnesota are required to submit to the State a report that identifies the aircraft based at their facilities for 180 days or more.
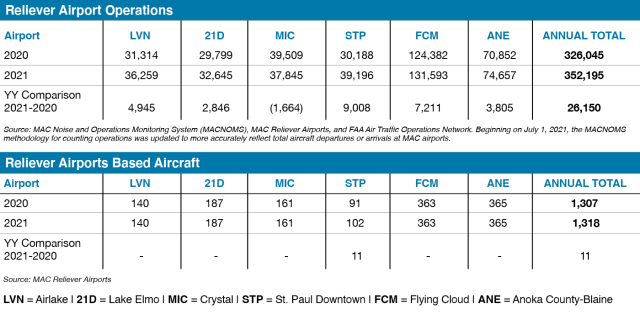
The tables below show the 2020 and 2021 reliever airport operations and reliever airport-based aircraft. The operations totals are obtained from the FAA for MAC reliever airports with an air traffic control tower. For the two reliever airports without an air traffic control tower (LVN and 21D), the operations totals are estimated through various methods and available data.
